


Visualizing the South is designed to build shared understanding of the region.
By mapping outcomes, highlighting patterns, and creating interactive dashboards, Visualizing the South presents the region as more than a collection of deficits and a place of community, local strength, and real opportunity for progress.
This month’s Visualizing the South explores how disaster risk and community resilience vary across U.S. counties. Use the dashboard to compare the National Risk Index (NRI) and Community Resilience Index (CRI), then explore how your county compares to others across your state.
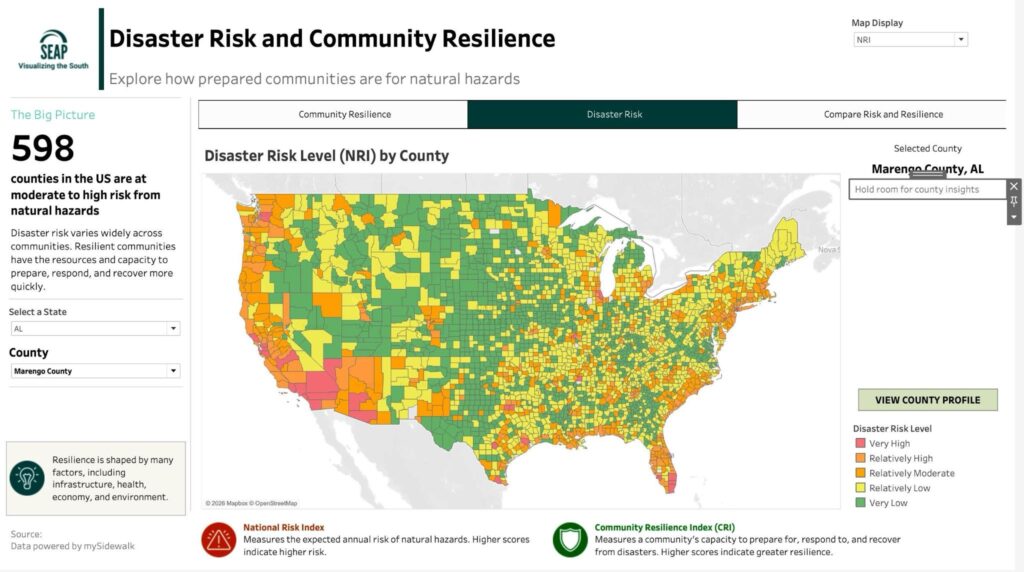
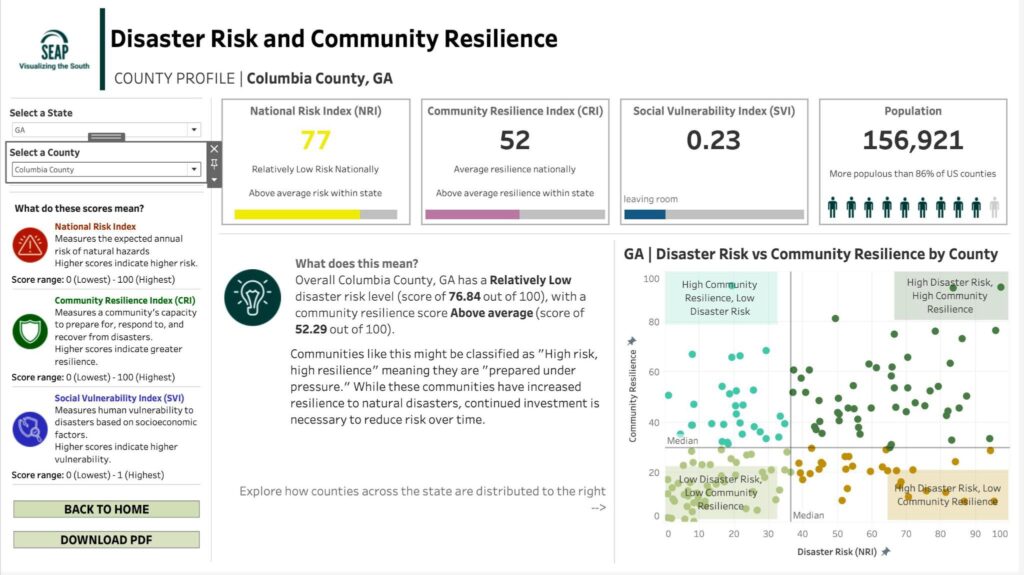
Natural hazards don’t affect every community the same way. Some counties face greater expected risk from natural hazards, while others have relatively low risk. But risk is only part of the story. Communities also differ in their ability to prepare for, respond to, and recover from disasters.
It’s also important to remember that these indicators provide a snapshot in time. A county with a lower disaster risk score is not immune to future disasters, just as a county with higher resilience can still experience significant impacts. Instead, these measures help us understand relative risk and preparedness based on the best available data.
Looking at risk and resilience together reveals a more complete picture. Some counties have high disaster risk but also strong community resilience, suggesting they may be better equipped to withstand and recover from major events. Others face a more difficult challenge, with higher disaster risk and lower resilience. These communities may have fewer resources available before, during, and after a disaster.
The dashboard also includes the Social Vulnerability Index (SVI), providing additional context about the socioeconomic factors that can influence how disasters affect people and communities.

Together, these measures highlight that resilience is about more than geography. It reflects the people, resources, infrastructure, and systems that help communities prepare for and recover from natural hazards.
How does your county compare? Explore the dashboard to see how disaster risk, community resilience, and social vulnerability come together to shape preparedness across communities.